Using the RADWIN OLBC for RADWIN 5000 HPMP
Continuing with the RADWIN OLBC for RADWIN 5000 HPMP Products:
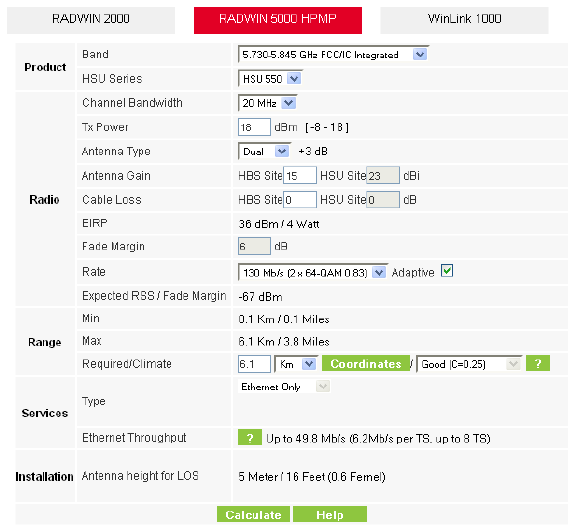
Figure 3-1: Link Budget window
To use the Link Budget Calculator for RADWIN 2000:
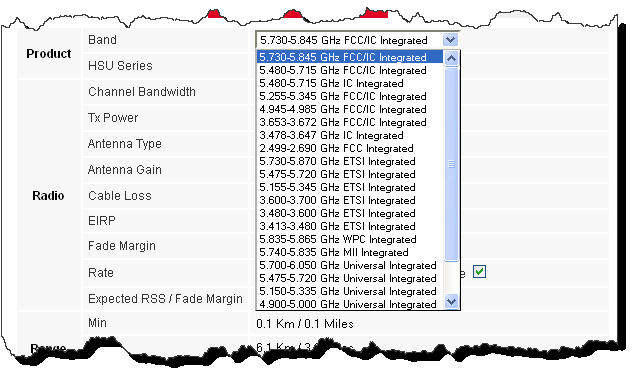
1. Choose a band from the drop-down list.
2. Choose the HSU type. There are three products from which to chose:
|

Figure 3-3: HSU Product Series selection
3. Enter the required channel bandwidth:

Figure 3-4: Channel bandwidth selection
4. Enter the required Tx power:

Figure 3-5: Selecting Tx Power
5. Enter the radio details.
|
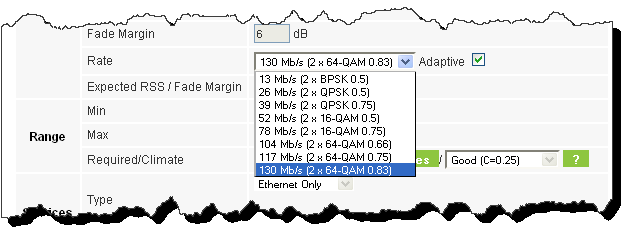
6. The Rate is chosen from a drop-down list:
The Fade margin is the minimum required for LOS conditions. For degraded link conditions, a larger Fade margin should be used.
The EIRP is given in dBm and Watts.
7. If the required range between the two link sites is known, you may enter it directly. Alternatively, you may enter the latitude and longitude of each site in the link, in which case the distance between them will be calculated and displayed.
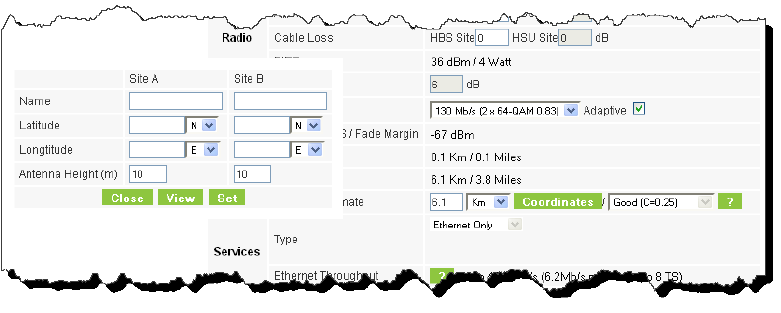
Figure 3-7: Calculation of distance from site coordinates
If for example, you enter:
Site A: 41.1°N lat 75.2°W Long
Site B: 40.8°N lat 75.0°W Long
and press Set,
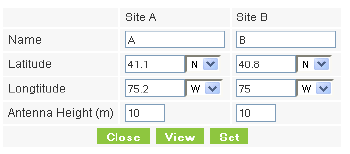
the range will be calculated and displayed:
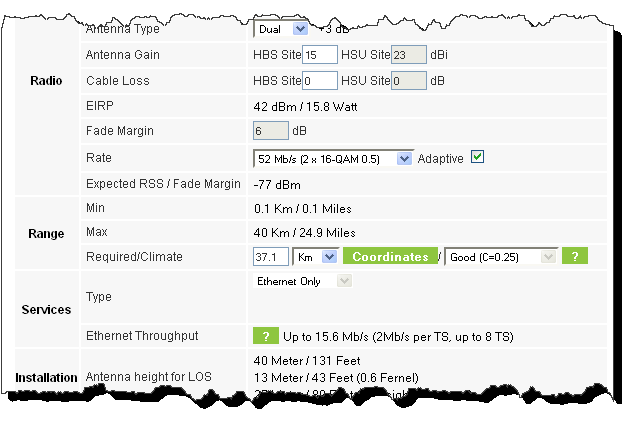
|
Alternatively, if you click View, you are offered a visual link profile in a new browser tab. See Chapter 5 for details.
8. Located to the right of the green Coordinates button is a drop-down list of Climactic C Factor values. It is only available if you choose a non-adaptive rate.
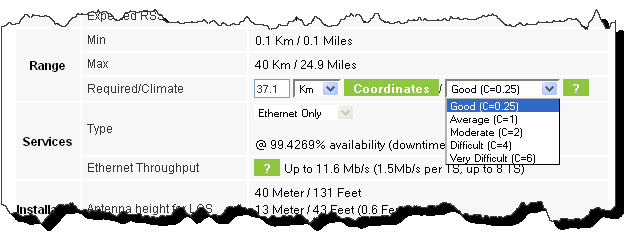
Figure 3-8: Climactic C Factors
For help about what these mean, click the  button to the right of the list in Figure 3-8.
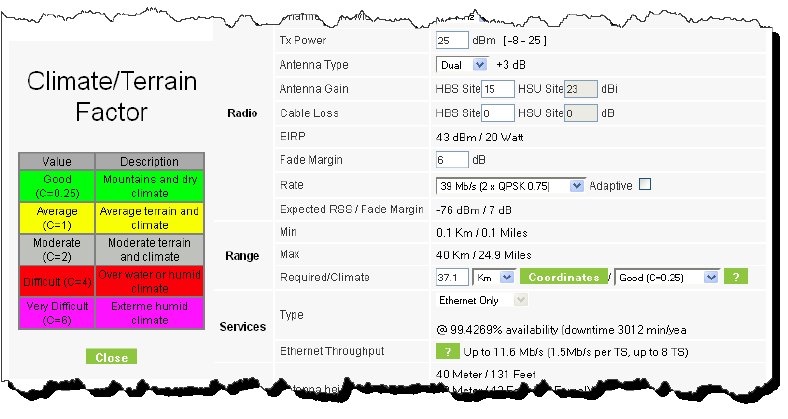
Figure 3-9: Climactic C Factor description
In Figure 3-10 we display a map of the world showing C Factor contours:
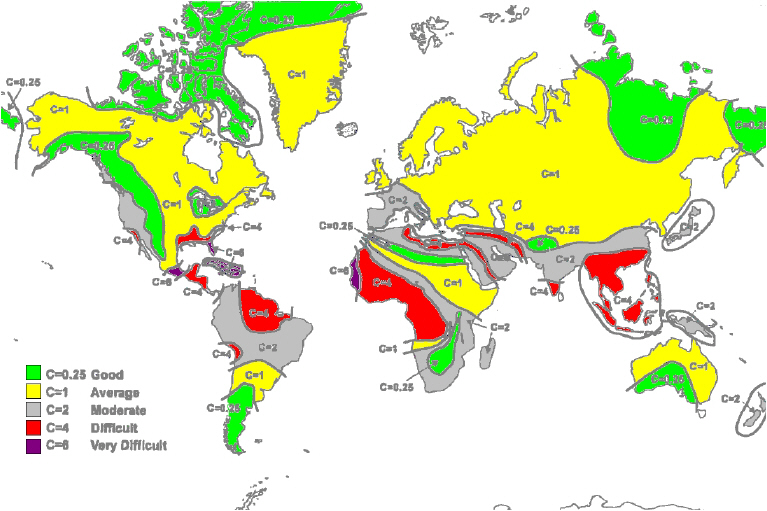
Figure 3-10: World map showing C Factor contours
9. After changing the C Factor, click Calculate to see the changed performance estimate.
10. Click Calculate to obtain the required performance estimate.
|
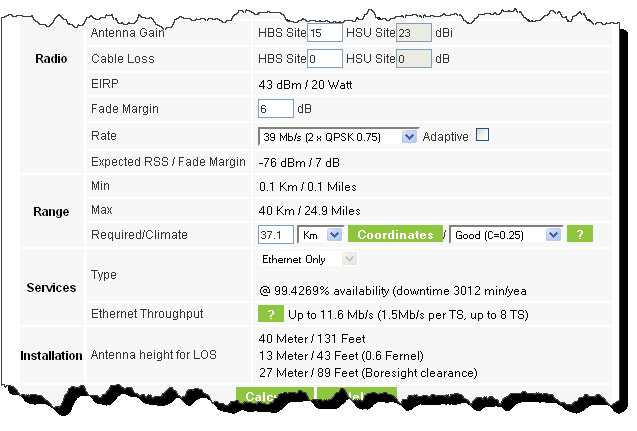
Figure 3-11: LBC - Results section
The Expected Performance parameters are calculated and displayed:
• Expected RSS - the expected RSS that the RADWIN Manager shows when the RADWIN 2000, RADWIN 5000 & WinLink 1000 ODUs are optimally aligned
• Services Type - Ethernet only
• Ethernet Rate - maximum throughput available for the chosen parameter combination
• Antenna height for LOS – the minimum antenna height required for line-of-sight operation. It is the sum of the height required for boresight clearance due to the earth’s curvature plus the height required to clear the Fresnel zone
The aggregate throughput and peak rate depend upon the number of time slots (TS) allocated to the HSU. To view the possibilities, click the  button to the right of Ethernet Throughput.
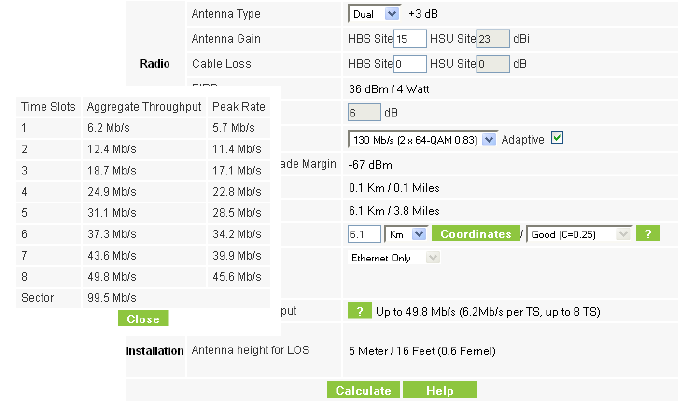
Figure 3-12: LBC - Aggregate Throughput and Peak Rate by TS allocation
If the expected performance is not suitable for your application, try different parameters and repeat the calculation.